"The machine they breathe into monitors how much oxygen they are using and how much carbon dioxide they are producing."
To become the best-of-the-best in any sport requires dedication, hard work and a never-say-die attitude. It also requires a lot of technology and use of data to monitor the progression and improvement of an athlete’s training.
For example, top endurance athletes regularly do a high pressure exercise called a VO2 max test. This basically involved them cycling, rowing or running at increasing speeds over around 10-15 minutes until exhaustion. The machine they breathe into monitors how much oxygen they are using and how much carbon dioxide they are producing; it’s a really smart piece of kit. From this data, you can correlate the athlete’s heart rate and determine what their optimal heart rate training zones are.
So, by running a simpler version of this test on school pupils, you can easily demonstrate the difference between aerobic and anaerobic respiration. It’s best performed on a Watt bike, with the pupil cycling for a couple of minutes to warm up and then sprinting as fast as they can for around 60 seconds, in order to get a really good build up of lactic acid in their legs.
The data produced actually shows the point at which their body could not produce enough energy via aerobic respiration and had to switch on anaerobic respiration to top up the energy provision. It’s great fun and makes a lasting impression!
Speaking of cycling, did you know that after the Beijing Olympics, where Team GB came to prominence in the cycling events, the cycling team destroyed all the bikes and data they had collected over the build-up to the event? They did so to ensure their technology didn’t fall into another country’s hands for the following Olympic cycle. Basically, they started the development for London 2012 from scratch… and it obviously worked, with the medal haul they pulled in.
"With a basic wind tunnel, pupils can still put their heads in with different types of helmet to see what happens when smoke is blown at them."
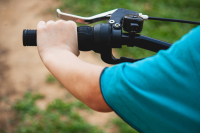
One of the key pieces of kit essential for cycling teams is a wind tunnel. It can help improve the aerodynamics of the bike, helmets and even the position the cyclist sits in during a race. With a more basic mobile version, pupils can still put their heads in and don different types of hat and helmet to see what happens when smoke blown through the tunnel (it’s nightclub smoke!) sticks to the cycling helmet and flows over the top in a smooth flow. You also get to see eddy currents, which are the swirls of air that form behind any moving object. You need to minimize these to increase speed as much as possible, and that’s why cyclists wear a helmet that is pointed towards the back - to smooth the airflow and reduce the number and size of the eddy currents behind them.
If you don’t think it makes a difference, Sir Chris Hoy once won one of his 1000m world championship races by a margin of 1/1000th of a second, which equated to a distance of 15mm…. that is a winning margin of 15mm over a 1000m race. You can’t get much closer than that!
There are also really cool apps that mimic a wind tunnel. You can draw shapes in a virtual wind tunnel and see how the airflow moves around it, plus have great fun demonstrating what happens to the airflow across different shapes and structures.
Usain Bolt is probably the most recognised and respected sportsman on the planet, so any exercise themed around him is memorable and inspiring. When he broke the world 100 metre record at the 2009 World Athletics Championships, the International Association of Athletics Federations (IAAF) had arranged for a series of sports scientists, bio-mechanists and coaches to analyse performance levels. From the video footage and monitoring during the race, they found the following stats about his amazing achievement.
- Average Stride Length was 2.41 m.
- Longest stride length was 2.95m.
- Number of strides to complete 100m was 41.
- Fastest speed was recorded at 65m into the race.
- The last three 10m sections were covered in 0.81, 0.83 and 0.83 seconds respectively.
- His top speed was just over 27mph.
This data confirms the reasons why Usain Bolt is so good at the 100m. In any race, it looks as though he is constantly speeding up and accelerating away from the rest of the athletes. However, he is actually reaching a higher speed and then maintaining it for a longer period compared to the others. Basically, he doesn’t slow down as quickly as the other athletes.
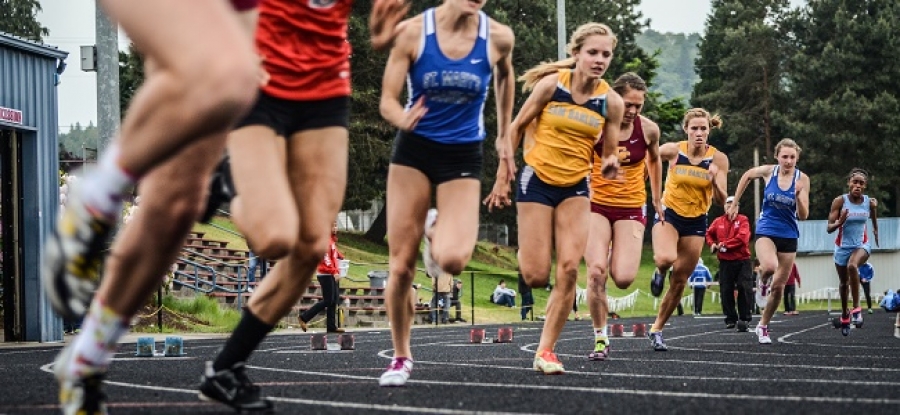
Imagine monitoring some of these same stats in your school, simply by using a set of timing gates and mini cameras that detect when someone crosses their beam. This triggers and stops a stopwatch, and can give you highly accurate times down to 1/1000th of a second. You could also set them up as a speed trap over 10 feet, so the pupils can see their peak running speed in mph.
The times and speeds collected could then be used to compare them to Usain Bolt (or other top athletes like Mo Farah and Jessica Ennis-Hill) and a discussion can be had about how stride length and stride frequency are the two main factors that influence your running speed.
You can also measure pupil’s ball throwing/kicking speed with a speed gun, test hand/eye coordination with a BATAK reaction wall, record jump height and distance with a special mat, test their flexibility in the Hexagon agility test and see how far they can go in the rowing machine challenge – and this data can also be mapped to all the different curriculum specs from the exam boards.
What’s more, pupils can measure lung sizes and ages with a spirometer, record an electrocardiogram (ECG) from their heart and calculate the angle of the heart in their chest, use an otoscope to video their eardrum and see what they will look like when they are 72 with age progression photography. They can also get to check out the effects of smoking, obesity and sunlight exposure.
Have you used similar technologies to teach health and fitness? Let us know in the comments.