Let’s start right at the beginning. Google Analytics is a free service provided by Google which tracks visitor activity on and around your web site. A small piece of code is placed on every page of your school web site and from this, Google can see every visitor to your site and keeps a record of key pieces of information: how they found your site, which pages they looked at, how long they stayed on your site, from which page they exited your site, and lots more.
All this information is collated into a format that is pretty straightforward to use and not very difficult to interpret.
As an aside, it is worth saying at this point the data Google collects is anonymous, so don’t worry too much about the privacy alarm bells that may be ringing.
Over the course of a few articles, I’ll be giving you some pointers on how you can use the information Google provides to make informed decisions about how you work online, what content works for your users, and what you can improve.
We’re going to start with some of the basics...
Key Data Insights
How do users find your web site?
Start Here: Traffic Sources > Sources > All Traffic
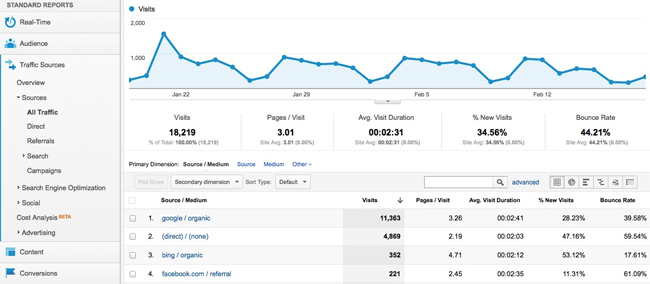
Use the Start Here location above to locate the key data on how your users find your site. In here you’ll see a list displaying Sources of users to your web site. This is a great place to start as you’ll get an immediate picture of how people find your web site.
To drill down for more detail, select Direct, Referrals and Search from the left hand menu; as an example, if you click on Referrals you’ll see any web site that links to yours that has provided your site with traffic.
If you select Search > Organic, you’ll see which keywords users have used to find your web site.
By looking at this data you can see how people are finding your site - you may be surprised to find that one particular site is referring lots of traffic or you’re not getting as many visitors to your site as you may have hoped. If, for example, you’re paying for additional exposure for a job vacancy listed on your site, you can tell if the referring site is sending you any potential applicants. If you’re using an email solution to send out your weekly newsletters to parents, you can quickly tell if they’re clicking on any of the links within those newsletters. (It’s not a big step to then find out their ‘path’ through your web site, but we’ll cover that later).
Top Tip: Use this data to influence how you name pages and titles on your web site. A school we work with offers BTECs in Engineering and they wanted to know why they weren’t getting many visitors to the page on their web site about that particular course. Unfortunately, every link and title on their site refers to an Extended Diploma in Engineering, not a BTEC in Engineering. By making a small change to their web site they now appear high in Google search results for a much more relevant search term, a search term that prospective students actually use!
Which pages are my users viewing?
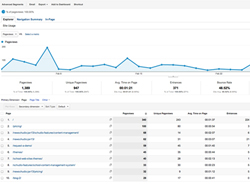
Start Here: Content > Site Content > All Pages
You will most certainly have content that you want to make sure your users are viewing; anything from your news and events to a donations page. The main thing to bear in mind is that your users will only engage with the content you want them to look at if they can easily find and use what they want to look at.
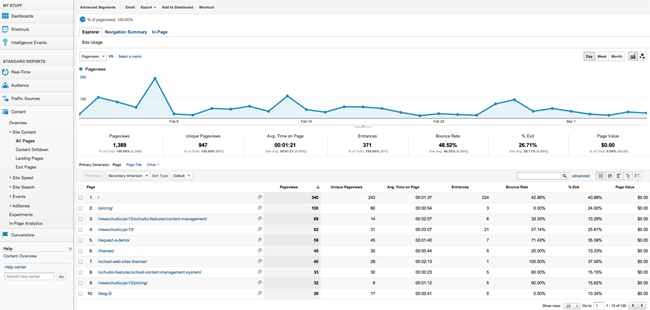
So, before we try to influence our users, we need to make sure they can find what they’re looking for and get what they need from that content. In All Pages you can see a list of pages on your site and Google gives you some really useful information here.
Pageviews
This column tells you how many times this particular page has been viewed in the time period displayed that top of the page.
Unique Pageviews
Here you can see how many times this particular page has been viewed by a unique user, not just how many times the page has been displayed.
Avg Time on Page
A great piece of information; if you’ve got an important article and your users are only on that page for, say, 4 seconds, you can tell immediately that they’re not engaging with that content.
What’s causing that? Is the page just text and unappealing? Break the content up with some images or video to retain your users attention or, shorten the article!
Entrances
This is how many visitors came to your site through this page first.
Bounce Rate
Tie this to Entrances - if this is the first page that your user sees, the bounce rate is the % of users who leave immediately without viewing any other pages on your site. If your bounce rate is around the 40% mark, you’re about average (source: Google). If it’s higher than that, interpret why that is.
It may be that the bounce rate is high for a page that contains all the information a user is looking for; an article or news piece on your site about something very specific. The user has all the information they need so they leave; contact pages quite often have higher bounce rates.
However, sometimes a page doesn’t meet the user's needs, or the site isn’t up to scratch or isn’t usable on a particular device the visitor is using. In this case they may well leave frustrated because they can’t get at the information they need. This is when you can use this key data to make improvements to your site.
Exit
This information shows you how many people exited your site via this page, but having already looked at other content.
Top Tip: Use this information to do a brief audit of your current web site - make a note of the pages on your site that you want to know how they’re performing and have a look at their respective Pageviews and Bounce Rates. Ask questions like: is the bounce rate for this page higher than my site average? If so, why? Is it normal? Is there anything I need to change in my site content to improve this?
This core information is the grounding and starting point for any work with GA and offers you the key data insights when looking at this kind of information. You can now make some simple, yet informed decisions about how you communicate with your web site users and whether your current web site is working for you.
In the next article, I’ll be looking to how you can use Google Analytics to influence the structure of your school web site to make sure your users can find key content as easily as possible.