
In-Page Analytics
Start Here: Content >> In-Page Analytics
What a brilliant piece of kit this is - when you open this option you’ll see a version of your site appear as part of the browser window. If you’ve got this set up correctly, you’ll see a percentage (%) value next to every link on that page. Hover over the link and you’ll get a little bit more information including the number of links and how many times this link appears on the page.
This is a quick way to get a snapshot of how people are interacting with your school or college website. If you study this data you’ll learn a lot about your users; don't assume you already know exactly what they’re looking for. (You can find this data in other parts of GA but this is the most visual and easy to use).
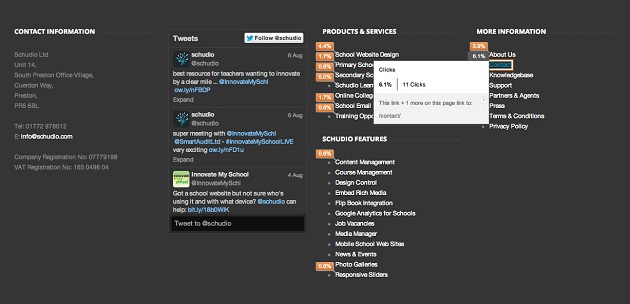
Primarily, users of our example website are looking for courses that are available at the 6th Form in question. This is backed up by a significant 9.7% of all users visiting the courses section on the site. The nearest rival is the new prospectus at 5.3%, which is also potential students.
The 6th Form wants more users to access the latest news and events to try to drive more people to apply. The idea behind this is that if potential students can see the exciting things that are going on at the college, they are more likely to be interested and apply.
To achieve this the number of users visiting news and events are tracked for a key period. Then the site is updated to make the news and events easier to access for these particular visitors. In addition, every individual course page can be designed to display news that is relevant to that course.
All of a sudden the web site is effectively personalising content for that visitor.
The result? A significant uplift in the number of visitors accessing the news content and, more importantly, they’re reading news which is relevant to them. This in turn has shown an increase in not only the number of online applications, but also improvements in streamlining the path to application on their site.
What now? Figure out what you want to achieve through your web site. By setting the goal first you can look at the data available to see where you can make influential changes. In this example, the goal of the school was to get more applications, so we analysed the behaviour of a particular user group - potential applicants - on the relevant page to inform our decisions on updating it to meet their needs.
Behaviour Flow
Start Here: Content >> Behaviour Flow
We’d be remiss if we didn’t point out that there are other pieces of information that can influence how you might decide to re-evaluate your site structure and content. One of these is looking at the behaviour flow of users through your website. This is primarily used to see how many people are being engaged by your content.
The different sections that you see are called nodes. These are points through which your traffic flows. Connections link nodes (a piece of content on your site) to another.
What we’re most interested in here is if there are paths that more of your users follow than others. If so, are these the paths you want your users to be following?
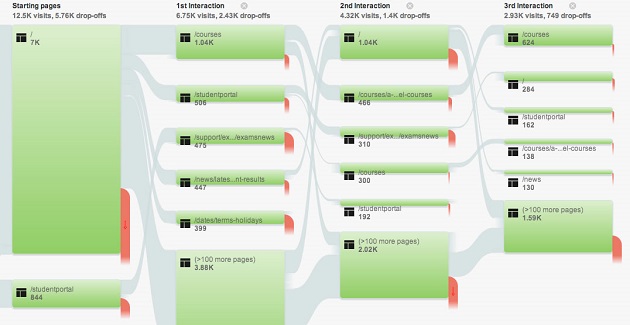
If you can see that certain paths through your site aren’t attracting as great a percentage of users as you’d like, you may want to rethink how you provide access to this content; an improved position in the site navigation perhaps.
For example, the Sixth Form wanted more users to access the latest news as the report showed that click-throughs were lacklustre. However, in this case, simply moving the link to News in the menu structure wasn’t enough, we needed to be more intelligent about how we wanted to achieve this goal.
By looking at the Behaviour Flow of our users alongside In-Page Analytics, we have provided an effective solution.
How can you apply this to your school or college? What are the key goals for your web site? It could be a small change is all you need, or it could be that you need to re-evaluate your entire website.
A little aside: Devices
This is a brilliant little piece of information which most certainly deserves a mention.
Start Here: Audience >> Mobile >> Overview
You need to know how people are accessing your website because you’ll be amazed at the number of users that are visiting you from a device that is not a laptop or PC. In the example of the Sixth Form, nearly 50% of all users accessed the site from a mobile device or a tablet.
Have a look at your website on both kinds of devices and ask yourself; does my site look good on a mobile device? Can I even use my site on a mobile device? If not, you may want to make improvements to the layout or have a separate automatically-adjusting mobile website that is easier to navigate on smaller screens.